
Doctors
See practice performance without living in reports, so clinical leaders stay close to production, case flow, and what needs attention.
DSO customer story


An Inc. 5000 company. One of the fastest-growing DSOs in dentistry.
Shared Practices Group (SPG) is a dentist-owned full-arch DSO growing through 50+ locations. Root is used throughout the organization — not only at headquarters.
“Everyone on the central team started checking our numbers 10x+ more frequently than before.”

Dr. Austin Davis
Chief Strategic Officer, Shared Practices Group
In his words
Before Root Data, what were the biggest challenges you had getting a clear view of performance across Shared Practices Group?
“Biggest challenge was having clean, accurate data in real time that was very quick and easy to access. Before Root, it would take me way too long to get access to the real-time data that I needed all in one place. It was such a barrier that I didn’t look at the numbers as much as I should because it was such a headache to get them.”
Dr. Austin Davis, Chief Strategic OfficerWhat changed for you and the leadership team once Root Data was connected across the organization?
“Everyone on the central team started checking on our numbers 10x+ more frequently than before. It was like everyone was flying blind and waiting until the end of the month to see how we did. Also, we were able to actually track the KPIs that matter to us without a ton of extra junk. The right KPIs unique to our company in one place without a bunch of other unnecessary data makes it very powerful.”
Dr. Austin Davis, Chief Strategic OfficerWho uses Root at SPG
Root is not reserved for a reporting analyst. At SPG it shows up in the practices and on the central team, so the people closest to the patient and the people running the network share the same numbers.
See practice performance without living in reports, so clinical leaders stay close to production, case flow, and what needs attention.
Run the day-to-day from the same KPIs the rest of SPG uses — appointments, collections, and new-patient flow included.
Stay aligned with what actually booked, showed, and converted, instead of working from a separate spreadsheet.
Compare locations, spot offices that need help, and keep the growing network on one operating picture.
The operating problem
SPG started as a dentist community and grew into a national full-arch platform. Opening locations quickly only works if doctors, office managers, smile consultants, and the central team can see the same performance picture — production, collections, new patients, bookings, and show rate — without rebuilding a spreadsheet for every office.
What SPG runs in Root
AI Chat and data
SPG teams do not have to wait on a report pull. Root AI Chat can answer questions across the connected practice, booking, and operating data, then turn the answer into a chart.
Ask how an office is performing, what changed this week, or which locations need attention.
Turn production, collections, new patients, bookings, and show rate into a visual without leaving chat.
The chat uses the same Root data as the dashboards, so HQ and the practices are not working from two versions of the truth.
Data options in chat
Operators can ask across the live Root data set, then have the answer charted instead of exported to a spreadsheet.
“Chart collections versus production for the last eight weeks.”
“Which offices had the weakest new-patient show rate last month?”
“Compare bookings to new patients seen by location.”
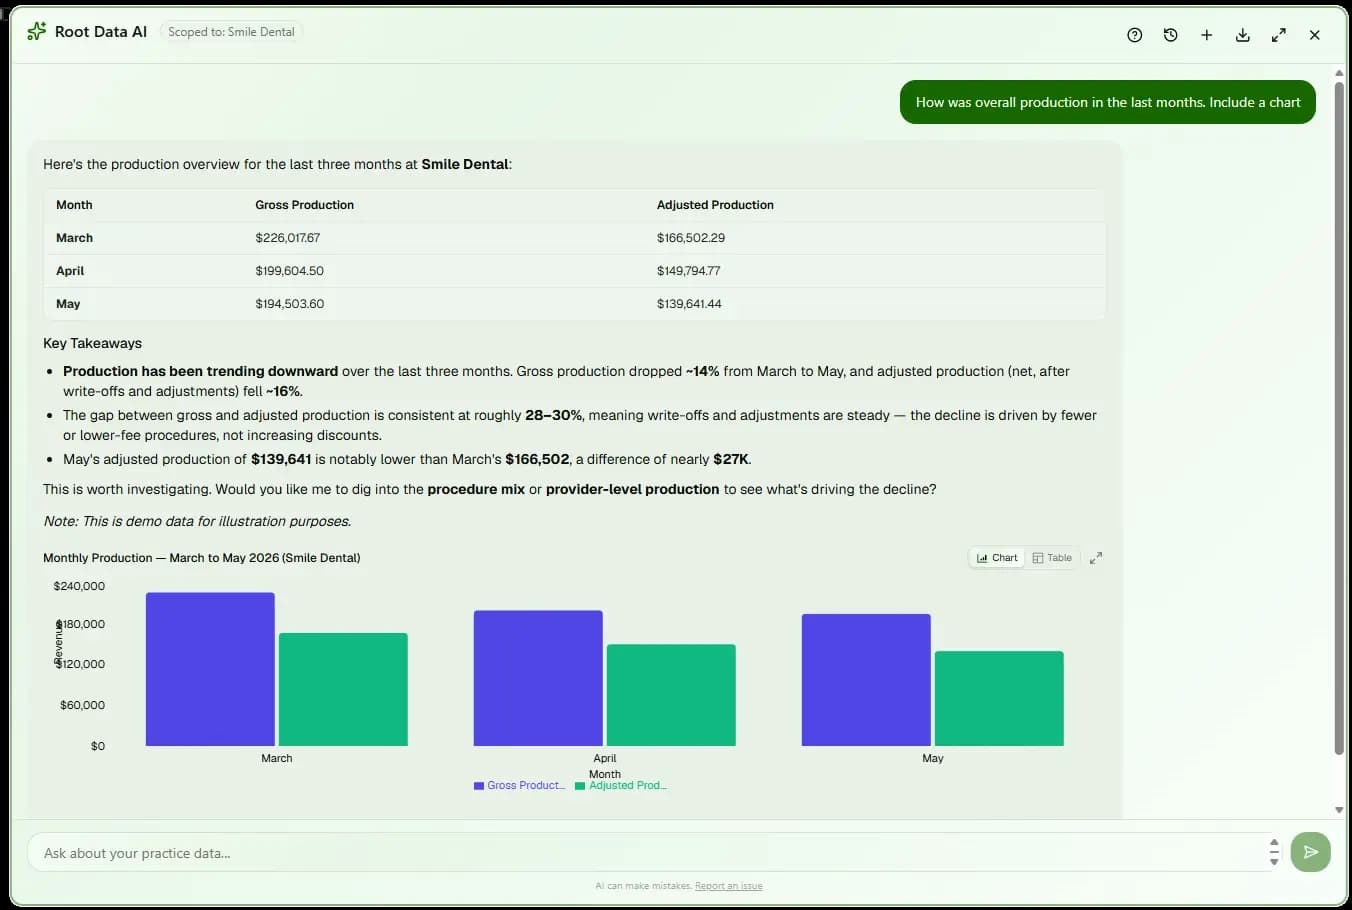
Weekly and monthly updates keep operators close to the week that just happened. The enterprise dashboard gives the central team a way to compare locations. AI Chat lets doctors, managers, smile consultants, and HQ ask across that same data and get charts back. Bookings and show-rate visibility keep acquisition honest as new offices come online.
“The right KPIs unique to our company in one place without a bunch of other unnecessary data makes it very powerful.”
If you are comparing offices, asking AI Chat across the live data, or trying to get every location on the same operating picture, start with the DSO product or a conversation.
SPG in the Root DSO directory