
How to Find Hidden Revenue in Your Dental Practice Without Touching a Single Spreadsheet
Most dental practice owners know their revenue number. Very few know where they're losing it.

Watch this video
Opens a dedicated video page for this article.
Most dental practice owners know their revenue number, but very few know where their losses are occurring.
The data is available - it's stored in your practice management software. The challenge is accessing it and making sense of it so it directly impacts your revenue.
Typically, this has involved generating reports, creating spreadsheets, hiring someone to analyze the data, or spending hours navigating dashboards designed for accountants rather than dentists.
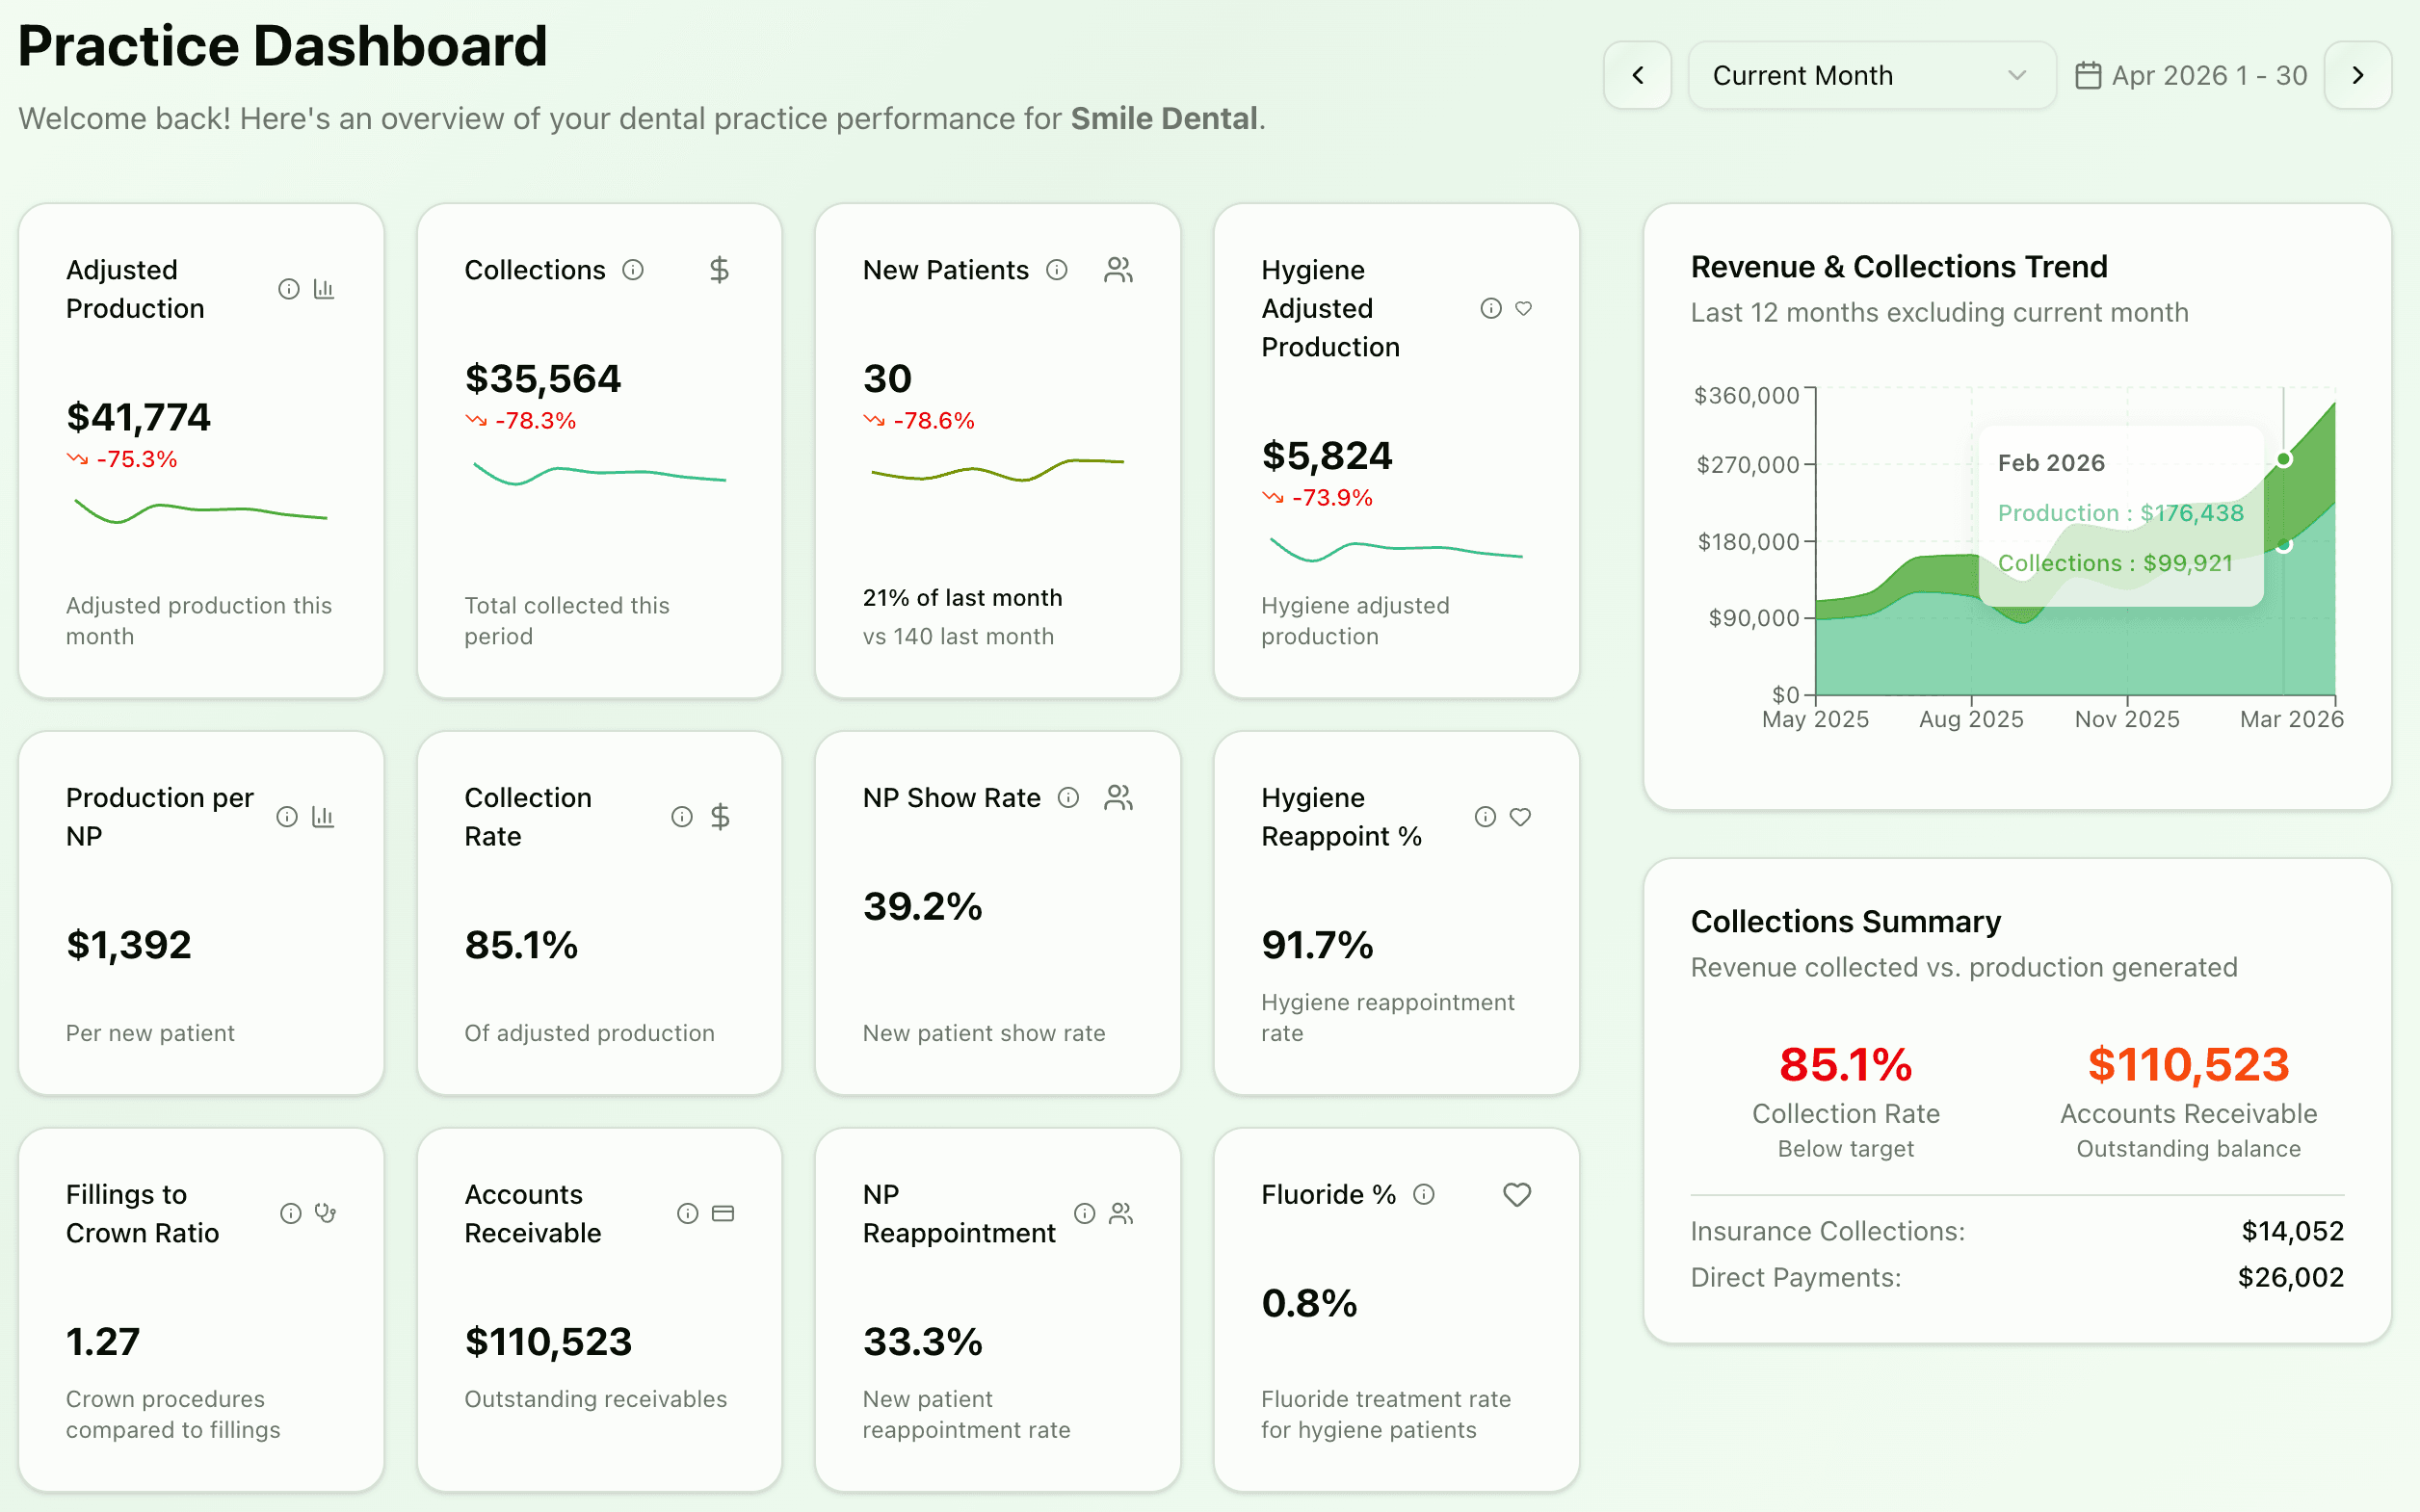
Quick Note: Check out the Root Data demo dashboard to see it in action.
Root Data offers a different approach, providing dental analytics tailored to the practice owner. With Root Data, the data comes to you, rather than the other way around. You can simply open a chat, ask a question in plain English, and receive a real-time answer based on your actual practice numbers.
This is how it works.
Start with one metric
The biggest mistake practice owners make is trying to look at all their data at the same time, which leads to feeling overwhelmed and taking no action.
Start with just one question. Let's use the hygiene reappointment rate as an example, a key metric in a general dental practice that often gets overlooked.
Last month, the practice had 123 out of 153 hygiene patients reschedule, giving them an 80% reappointment rate. This is okay, but it's not the best it can be. There were 30 hygiene patients who didn't schedule a future appointment.
We asked a simple question: what would a 5% improvement in the reappointment rate do to monthly revenue?
The answer is that it would mean 7 more patients per month, which is worth $18,000 per year. Over 10 years, this adds up to $180,000, all from a small 5% improvement in one area.
This kind of clarity can change the way a practice owner runs their business.
Push the number further
Once you have the reappointment rate figured out, the next question is about volume. What if you increased the total number of hygiene patients seen from 153 to 183 per month?
Root calculated the result right away: an extra $6,500 per month and $80,000 per year.
It also showed us exactly how to achieve this. We would need to add one to two more hygiene patients per working day. This could be done by extending hygiene hours, reducing no-shows and cancellations, reactivating overdue recare patients, and opening a Saturday morning slot.
These steps are concrete and actionable, directly linked to the target number you're trying to reach.
Find the leak you did not know existed
This is where things get interesting. The practice's cancellation and no-show rate was 16.5%, which is higher than the industry benchmark of 10%. This difference is not just a scheduling issue, but also a revenue problem that's easily overlooked.
The root of the problem was quickly identified, with no need for extensive analysis. It showed how reducing cancellations from 16.5% to 10% and improving reappointment rates from 80% to 85% would lead to exactly 183 hygiene patients per month. These dental metrics are connected, and their impact adds up to the same result.
This insight is often missed by practice owners, not because they lack intelligence, but because they've never had a tool that clearly shows them the connection.
Model a new revenue stream in minutes
To go from 153 to 183 hygiene patients, we needed an extra boost. We asked Root to create a conservative model for a Saturday morning hygiene schedule.
Keep it simple: five hours, be conservative, and show us the numbers.
The result was 16 patients every Saturday, with four Saturdays per month, totaling around $41,000 per year. Adding just one Saturday slot filled the gap and paid for itself.
Turn these findings into a plan for your team.
After just one Root Data session, the practice owner had a clear plan for the next 3 to 6 months.
The plan was to focus on improving hygiene and reappointment rates at the same time. First, try out the Saturday slot and use the extra revenue to reduce no-shows. By optimizing two areas of the practice together, we got results from just one conversation.
No need for an analyst, spreadsheets, or wasted time.
The compounding effect
$78,000 to $119,000 per year was hidden in this one practice, untouched, because no one had asked the right questions about the data.
The revenue was always there, but Root made it visible.
Small optimizations can add up quickly. For example, adding one Saturday slot, improving reappointment rates by 5%, or reducing the cancellation rate to benchmark levels. On their own, these changes may not seem significant, but together, they can add hundreds of thousands of dollars to your practice over 3 to 5 years.
This is what practice growth looks like when you use dental analytics instead of relying on instinct.
Want to see what your practice data is telling you?
Try Root Data free for 30 days. Simply connect your practice management software, start a chat, and ask questions. There are no setup calls or hassle, just straightforward answers.
Sign up at rootdata.ai and find out exactly how much revenue your practice has been leaving on the table.
Want more insights like this?
Connect your practice management system to Root Data and get clear, actionable insights on your production, collections, and hygiene.
Explore Root Data