This Dental Practice Leaves $377,000 on the Table Every Year. Here's Why.
Most dental practice owners focus on attracting new patients, marketing, and increasing production volume. They hire staff, advertise, and work hard to get more people through t...

Watch this video
Opens a dedicated video page for this article.
Most dental practice owners focus on bringing in new patients, running marketing campaigns, and increasing production. They hire staff, advertise, and work hard to get more patients in the door.
At the same time, one key metric is quietly costing their practice tens of thousands of dollars each year. However, many owners don't pay close enough attention to it to realize its impact.
This metric is the dental case acceptance rate.
What Dental Case Acceptance Rate Actually Means
Dental case acceptance is simple to understand. For every 100 treatment plans your providers present, how many patients actually follow through with them?
The industry standard is 60%. Top-performing practices achieve 75% or higher. Average practices usually fall between 30% and 45%.
Quick Note: See Root Dental in action here.
If your practice is on the lower end, you're not just missing out on potential revenue - you're losing money every week. This is because your patients already need the treatment, your doctors have already diagnosed the issue, and your team has already spent time explaining the plan. You've done the work, but the patient leaves without committing to the treatment.
This metric can be very costly for a general dental practice when it's not on track, and it often goes unnoticed in real time.
The Real Cost of a 4-Point Drop in Case Acceptance
Here is a real example from practice data inside Root Data.
A practice had a dental case acceptance rate of 36%. This was not a disaster, but it was not good either. Six months earlier, the same practice had a 40% rate. The numbers clearly showed what was happening.
The average treatment plan was worth $747. Over 5.5 months, the practice presented 1,621 plans to patients. At a 40% acceptance rate, this meant 648 plans were accepted, resulting in $484,005 in revenue. At 36%, the number of accepted plans dropped to 584, and revenue was $436,103.
The difference was a $47,902 loss in production over 5.5 months, or about $8,700 per month. If this gap persisted for a year, it would amount to over $100,000 in lost revenue.
This is a conservative estimate, as it does not include the additional production from follow-up visits, buildups, or the long-term value of patients who commit to care.
Now, let's look at what an improvement would mean.
The practice calculated what would happen if they had a 50% acceptance rate. With 295 plans presented per month, and an average value of $747, they found the following. At 36% acceptance, they had 106 accepted plans per month and $79,200 in monthly production. At 50% acceptance, they would have 148 accepted plans and $110,600 in monthly production.
This would be a monthly gain of $31,400. The practice would not need to acquire any new patients to achieve this. Over a year, it would mean an additional $377,000 in production, using the same patient base, chair time, and diagnostic workload. No extra marketing spend or overhead would be needed, just better use of the existing opportunities.
Why Dental Case Acceptance Rates Drop and How to Fix Them
Most case acceptance problems stem from two main issues: how costs are handled and how urgency is presented. Fix these two issues, and the numbers will improve.
A common mistake is treating financial discussions as an awkward afterthought following the clinical presentation. Patients sense this discomfort and respond in kind. They often leave to think it over, which usually means they don't come back.
The solution is to make the cost conversation feel normal before it becomes sales-like. When confirming appointments, the front desk should let patients know that if the doctor recommends treatment, someone will go over the costs and payment options with them before they leave. This sets expectations early, so there are no surprises at the end.
During the appointment, the provider explains the clinical side. Then, a treatment coordinator or trained front desk team member handles the financial part. They present two or three payment options side by side, making the patient feel in control rather than pressured.
The team needs to shift their mindset: they're not selling anything, they're removing a barrier to care. Patients who decline treatment due to cost confusion aren't making a health decision; they're making a fear-based decision. The team's job is to eliminate that fear.
The second key factor is making the cost of waiting clear. Most patients don't decline treatment because they distrust their provider; they do so because the problem doesn't hurt right now, and waiting feels safe.
Make the consequences of waiting specific and real. Explain in simple terms what a small cavity costs to fix now versus what it costs if it becomes a more serious issue requiring a crown. Describe what happens when a cracked tooth finally breaks. Connect gum disease at its current stage to what bone loss and tooth loss might look like in the future.
Show the patient an intraoral photo, point out the problem, and compare it to a healthy tooth. Patients are more likely to accept treatment when they can see the issue with their own eyes.
Present urgency as professional guidance, not pressure. Telling a patient you'd like to address an issue within the next four to six weeks, while it's still straightforward, is different from telling them they need to do it now.
Everything Else That Moves the Number
Financial presentation and urgency framing are the most effective tools. They are not the only ones, though.
A structured follow-up system can recapture a significant number of patients who initially said no. This can be done with a call after 48 hours, a text after two weeks, and a letter after 30 days. This sequence can close a meaningful number of cases without requiring additional diagnoses or chair time.
Breaking down large treatment plans into smaller phases makes it easier to get the first yes. A $5,000 plan can be overwhelming, but a $1,200 Phase 1 is more manageable. Once a patient agrees to Phase 1, they are more likely to continue.
Discussing patients who received unscheduled treatment during the morning huddle helps the team prepare to present their options again before the patients leave, without being asked.
Training in verbal presentation is more important than many owners think. Even if the clinical recommendation is the same, the way it's presented can affect whether the patient says yes or no. Small differences in presentation can add up over hundreds of appointments.
All these strategies come back to one key principle: patients make better decisions when they have clear information. This includes understanding what's wrong, the cost, the risks of waiting, and their payment options. When the team consistently provides all four, case acceptance increases and practice growth follows.
You Cannot Fix What Practice Management Software Hides
Practices that consistently reach 60% or higher keep a close eye on this number. They track their case acceptance rate weekly and monthly. They also know the average value of their treatment plans and which treatments patients are most likely to decline.
Most practices lack this visibility. They often don't find out their case acceptance rate is dropping until weeks after it's started to slip, and sometimes they don't even notice. This delay can be costly.
The information you need is already in your practice management software, but it's hidden in reports that are more suited to accountants than practice owners. As a result, these reports usually go unrun, and key dental metrics that affect revenue are left unmonitored.
This is where dental analytics comes in to fill this gap.
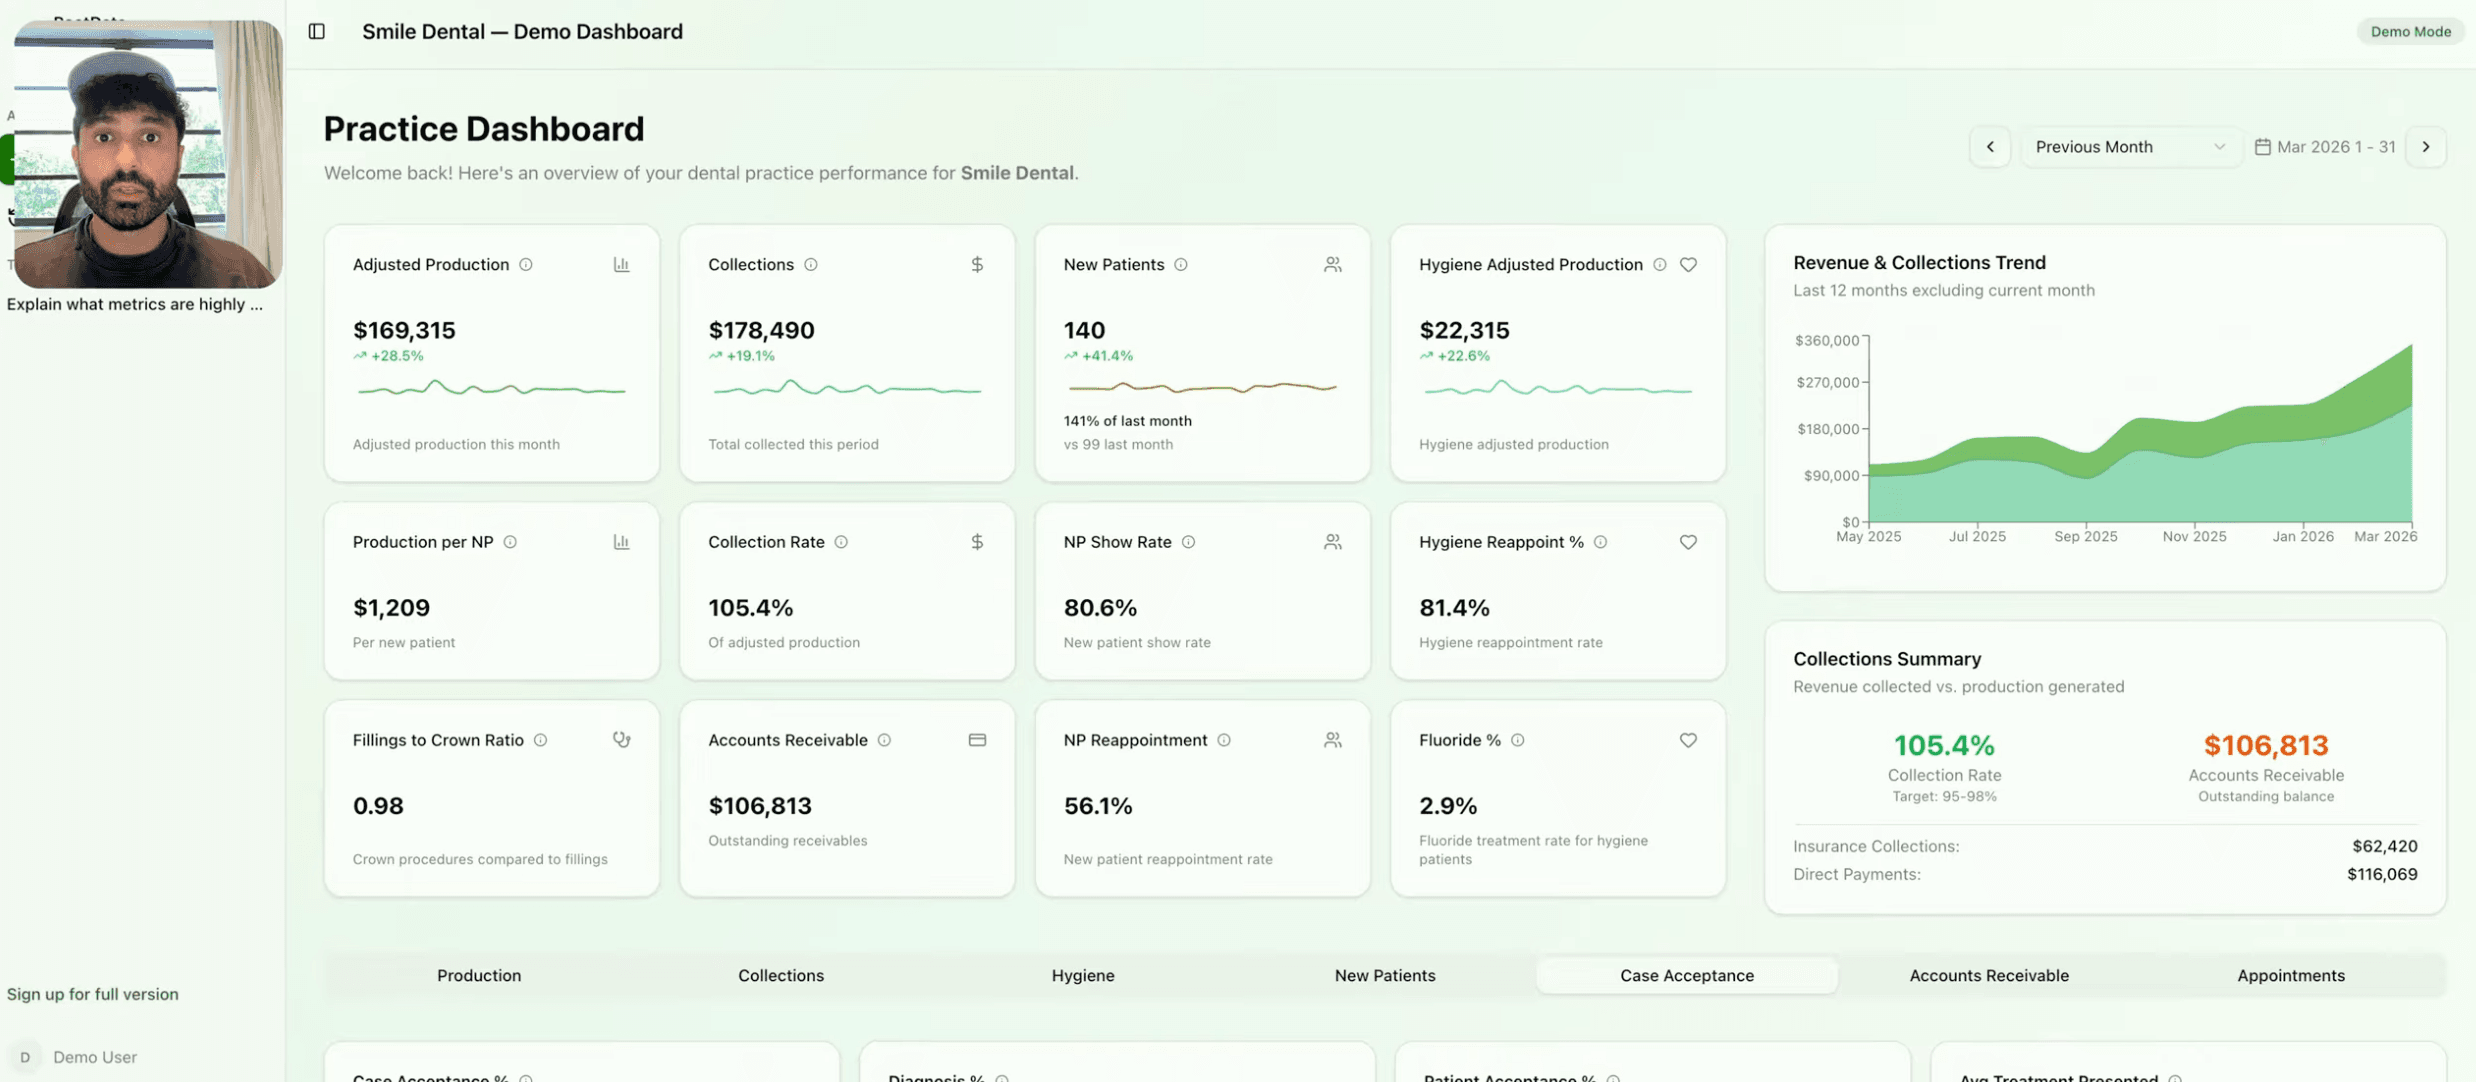
Check Your Dental Case Acceptance Rate for Free
Root Data connects to your practice management software and surfaces the numbers that actually drive revenue, including dental case acceptance rate, average treatment plan value, and the production you are leaving on the table every month.
How to get started:
Go to rootdata.ai and click Get Started
Create your account
Connect your practice management software. Setup takes a few minutes.
Open the AI chat and ask what your case acceptance rate is this month.
The same dental analytics platform a 50-location DSO uses to run every practice is now available to single-location owners. Your first 30 days are free.
If your dental case acceptance rate is below 60%, Root Data will show you what it is costing you in dollars per month and point to the highest-leverage place to start. Most practices find out within the first week that they are losing more than they thought.
Want more insights like this?
Connect your practice management system to Root Data and get clear, actionable insights on your production, collections, and hygiene.
Explore Root Data